Cookies and Privacy

We use technology on our website to collect information that helps us enhance your experience and understand what information is most useful to visitors.
By clicking "I ACCEPT," you agree to the terms of our privacy policy.

Cirata applies the highest standards to its use of data and its compliance with data-protection regulations across our marketing and website. Our Data Protection Officer can be contacted at DPO@cirata.com. You can change your cookie settings at any time via the link in our footer.

Cookie Setting

Observability extension

Observability extension

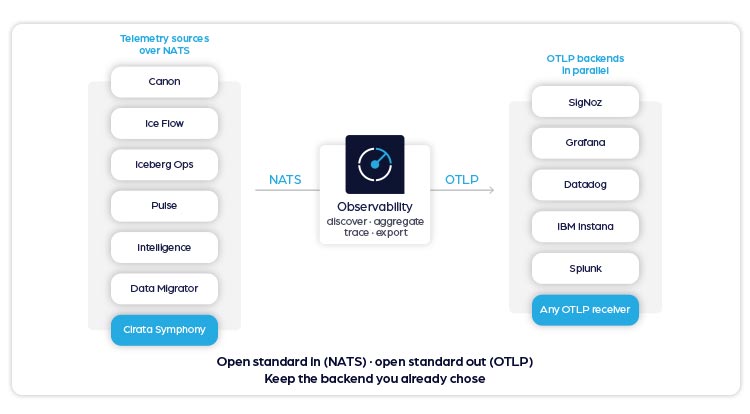
See your entire Cirata Symphony estate as one OpenTelemetry stream, every extension, every signal, into any backend you already run.

Built by Cirata | Tech Preview

Open standard in, open standard out

Observability is built on OpenTelemetry, the consensus protocol every major backend now ingests natively. It collects telemetry over Cirata Symphony's messaging fabric and emits it as plain OTLP, so your telemetry tier is portable rather than disposable. Switch backends without re-instrumenting a single extension.


Collects from:
Canon · Ice Flow · Iceberg Ops · Pulse · Intelligence · the Symphony platform itself · any extension that adopts the observability SDK


Forwards to:
SigNoz · Grafana / Tempo · Datadog · Splunk · IBM Instana · any OTLP receiver — one backend or several in parallel

Built on - open standard in - open standard out

What it does

  • Auto-discover every Symphony extension and the platform itself, no agents, no scrape configs, no static endpoint lists to maintain.
  • Collect metrics, logs, and traces over Cirata Symphony's messaging fabric, each signal on its own independently tuned schedule.
  • Stitch one distributed trace across every extension, CLI → platform → extension A → extension B is a single tree, not a forest of orphans.
  • Forward plain OpenTelemetry to any backend, SigNoz, Grafana, Datadog, Splunk, Instana, or several at once.
  • Tune intervals, batch sizes, and collectors at runtime, no restart, no redeploy, no agent to reload.
What it does screenshot 1
What it does screenshot 2

Use cases

End-to-end incident traces

When an incident crosses Canon, Ice Flow, and Pulse, get one distributed trace covering every messaging hop, instead of a post-mortem that stalls on "which extension was involved, and in what order?

Vendor-portable telemetry

Run SigNoz for engineering, Datadog for the SRE team, and Instana for the IBM side, all from a single aggregation pass. Switching primary backend is a config change, not a re-instrumentation project.

Regulated-industry evidence

Answer the auditor's question, can you reconstruct the request path behind a customer-visible failure, and can you prove it? With cross-component traces and a verifiable audit trail of every collector change. Built for DORA, Basel III, NYDFS, and APRA CPS 230.

Zero-touch source coverage

Roll out a new extension and its telemetry flows the next aggregation cycle. No collector config update, no restart, no operator ticket. Cirata Symphony's extension lifecycle is the telemetry-source lifecycle.


How it works

Discover

Observability lists messaging services and matches the standard telemetry subject pattern. Every extension that registers it is found automatically.

Aggregate

Each signal, metrics, logs, traces, is pulled on its own schedule, merged, and split into export-sized batches. Trace context rides every messaging call, so spans chain into one tree.

Export

Each configured collector gets its own OTLP client. One aggregation pass fans out to every backend you've enabled, with TLS, headers, and per-signal toggles per destination.


Technical details

Protocol OpenTelemetry (OTLP) out, http/protobuf (port 4318) and grpc (port 4317); TLS and mutual TLS supported. Collected over Cirata Symphony's messaging fabric.
Signals Metrics, logs, and traces, each aggregated on its own independent cycle (default 30s, minimum 10s).
Discovery Messaging service discovery on a fixed subject contract, cirata.extensions.<name>.metrics/logs/traces and cirata.symphony.*. New extensions picked up the next cycle.
Backends Any OTLP receiver, SigNoz, Grafana / Tempo, Datadog, Splunk, IBM Instana, multiple collectors in parallel, each with independent endpoint, headers, TLS, and per-signal toggles.
Operator surface UI, REST, CLI, and MCP over one OpenAPI contract (13 endpoints); configuration in JetStream KV, applied at runtime with no restart.
SDKs Go, Python, Java, and Rust, one observability module each. Call enable once to register metrics, logs, and traces.

Other Cirata Symphony extensions

Cirata Symphony Pulse extension
Control, understand, coordinate, and automate your data estate using simple prompts.
Data Migrator extension
Fully automated, zero-downtime or risk, continuous petabyte scale data migration between data environments.
Intelligence extension
Connect your data estate to any AI model, without writing a line of integration code.
Orchestration extension
A vendor-neutral control plane for workflow orchestration on Cirata Symphony. Orchestration connects to the workflow engines you already run, behind one unified Orchestrator interface.
Ice Flow extension
Manage data in Iceberg-native, open standard formats, between any pair of catalogs, across vendors, clouds, and on-premises, without compromise or lock-in.
Canon extension
Replicate Kafka across any vendor mix, with offsets every instance agrees on, schemas that travel with records, and failover you can actually rehearse.

Want to see the Cirata Symphony Observability extension in action?

Let us show you how the Cirata Symphony Observability extension is a revolutionary new data extension to fit your organizational needs.
Schedule a direct 1:1 demo with our CTO, Paul Scott-Murphy.